
What Is The Sku Clustering/Segmentation?
SKU (Stock keeping unit) is a unique alphanumeric code that allows tracking of products. SKU as a concept is the term retailers use to differentiate products and manage inventory levels.
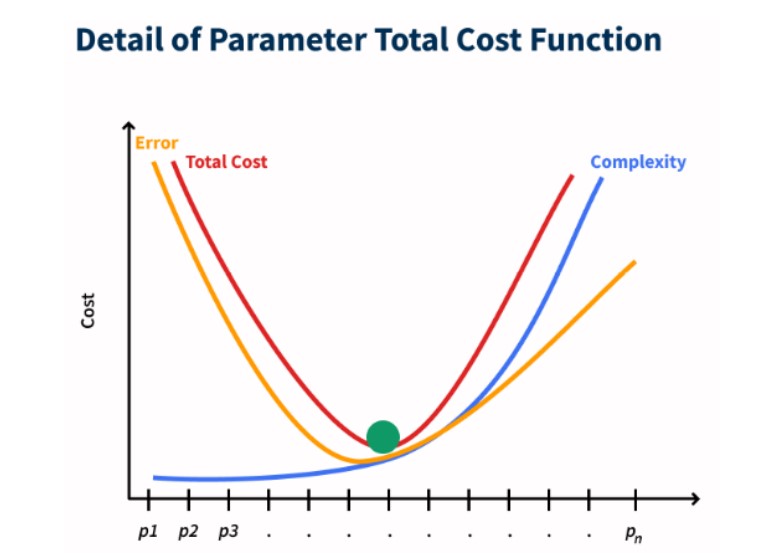
The number of SKUs in companies can vary between 100 and millions depending on the service provided. When the size of an SKU increase, managing will be very complex, and strategic decisions about the products will be made based on the overall average. When deciding on the overall average, there will always be an important outcome that is missed. This is a mathematical formula and how much detail and cost must be incurred to seize the missed opportunity.
The chart below shows the cost function with the detail of parameter management for SKUs. With SKU clustering/segmentation solution, you can make strategic management with the optimum level/label and maximize your profitability. Sectors that especially need SKU clustering/segmentation solutions can be listed as #retail, #game, #insurance, #e-commerce, #banking.

How To Use Sku Segmentation/Clustering Results?
Clustering/segmentation is done to reduce complexity in process management. Cost advantage and profit increase with the decrease in complexity are expected outputs.
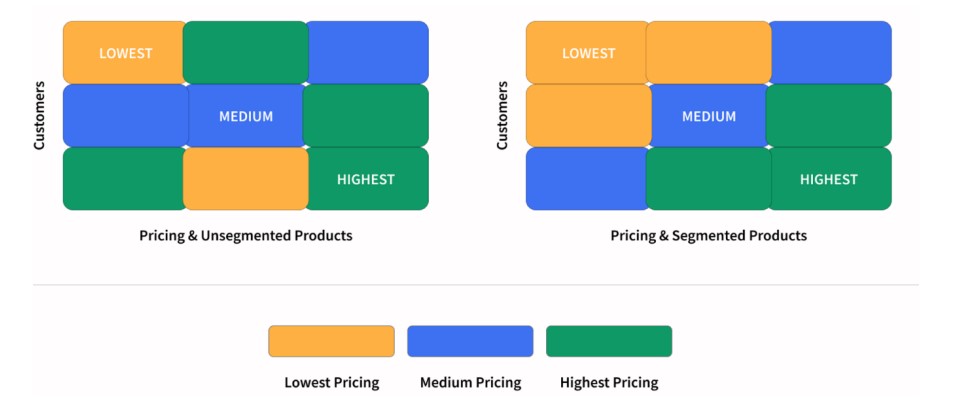
The areas where SKU clustering/segmentation results for different sectors can be used directly can be summarized as follows.
The following image shows a simple grouping of results for customers and products.
What Is The Working Principle Of Clustering/Segmentation?
There are different approaches and methods in clustering models. These approaches may show different performances according to different datasets. Therefore, a single method should not be used in a dataset and should be considered versatile.
In general, there are 4 types of clustering algorithms;
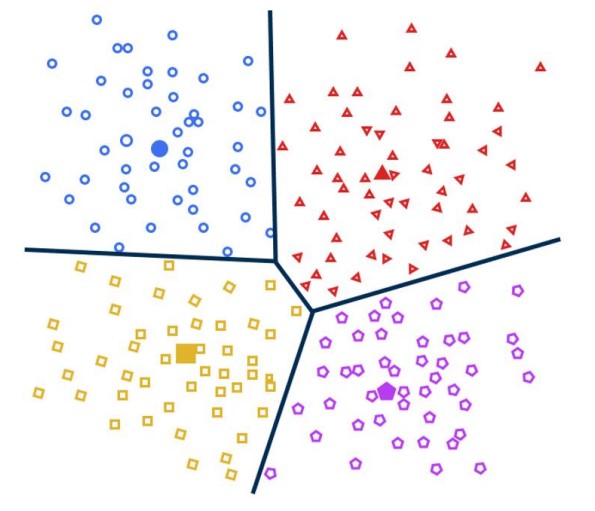
An example of centroid-based clustering
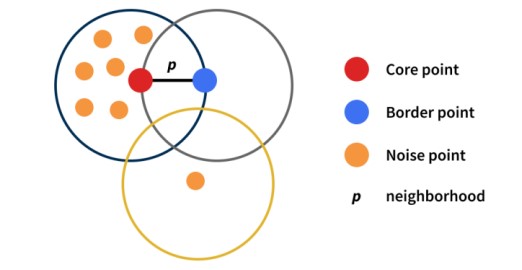
An example of density based clustering
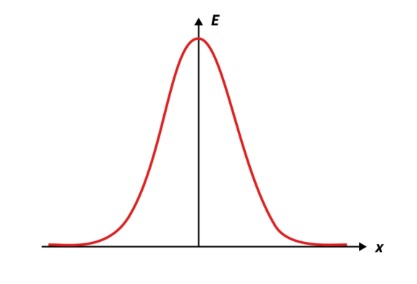
Gaussian distribution graph
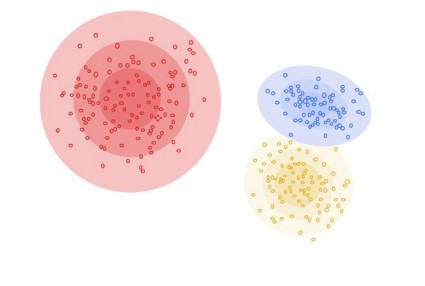
An example of distribution based clustering
How Should Clustering/Segmentation Results Be Interpreted?
Clustering/segmentation is an unsupervised learning technique. In this technique, the labels and implications of the data are inherently unknown. Aims to combine together the data by looking at the meaningful common aspects. Accuracy is determined by calculating metrics that measure how meaningful the combined data is. These metrics can be summarized as follows;
For which variables the created clusters/segments stand out is as important as its modeling. What clusters/segments tell processes? How to take action specific to segments? In order to answer these questions efficiently, it is necessary to be able to see what the clusters are telling. Therefore, visualizing and summarizing, and explaining the results in a way that can be interpreted becomes the most important issue.
The following methods can be preferred for the interpretation and understanding of segmentation results;